Compiling Batters’ Walks & the 1932 American Association Walks Totals, Part One by Will ChristensenWorking with minor-league stats can be like trying to put together a jigsaw puzzle with kids around -- it’s slow going and invariably pieces end up missing.
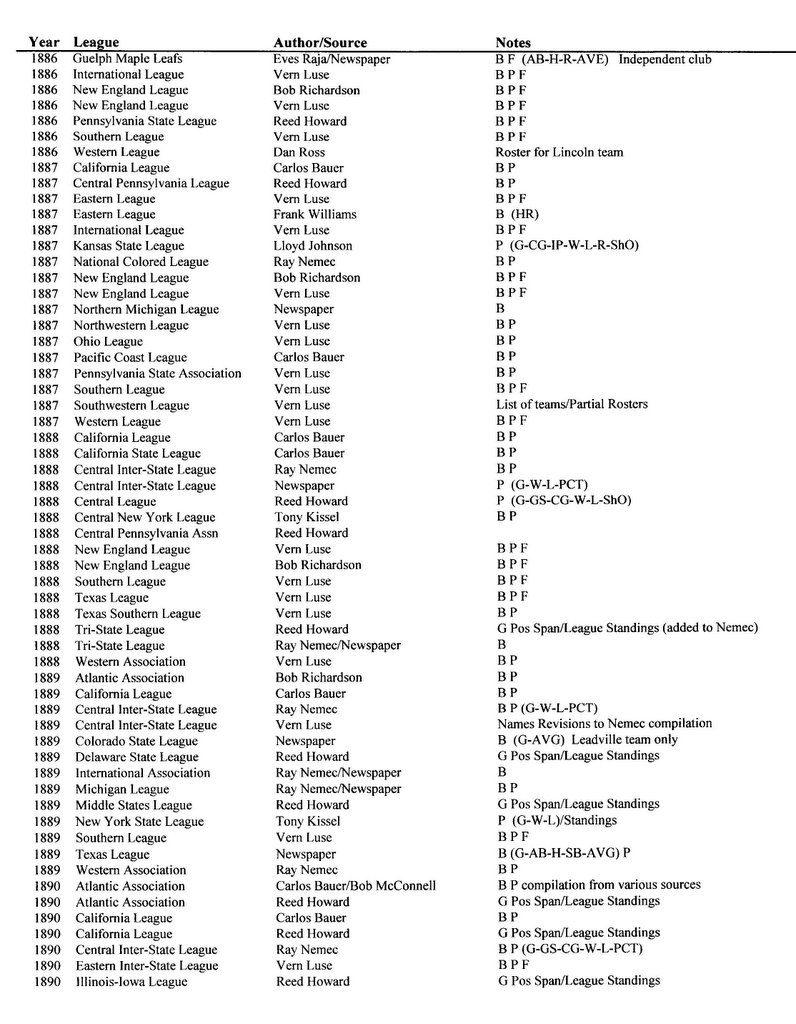
Some leagues were diligent at keeping track of information. The American Association was one of them. For example, it kept batter walks consistently back to 1913.
Walks are one of the most important and overlooked categories when it comes to evaluating offense. They’re one of the big four. If you know only a player’s at bats, hits, walks and total bases, you can come up with a reasonably accurate assessment of a player’s offensive contributions.
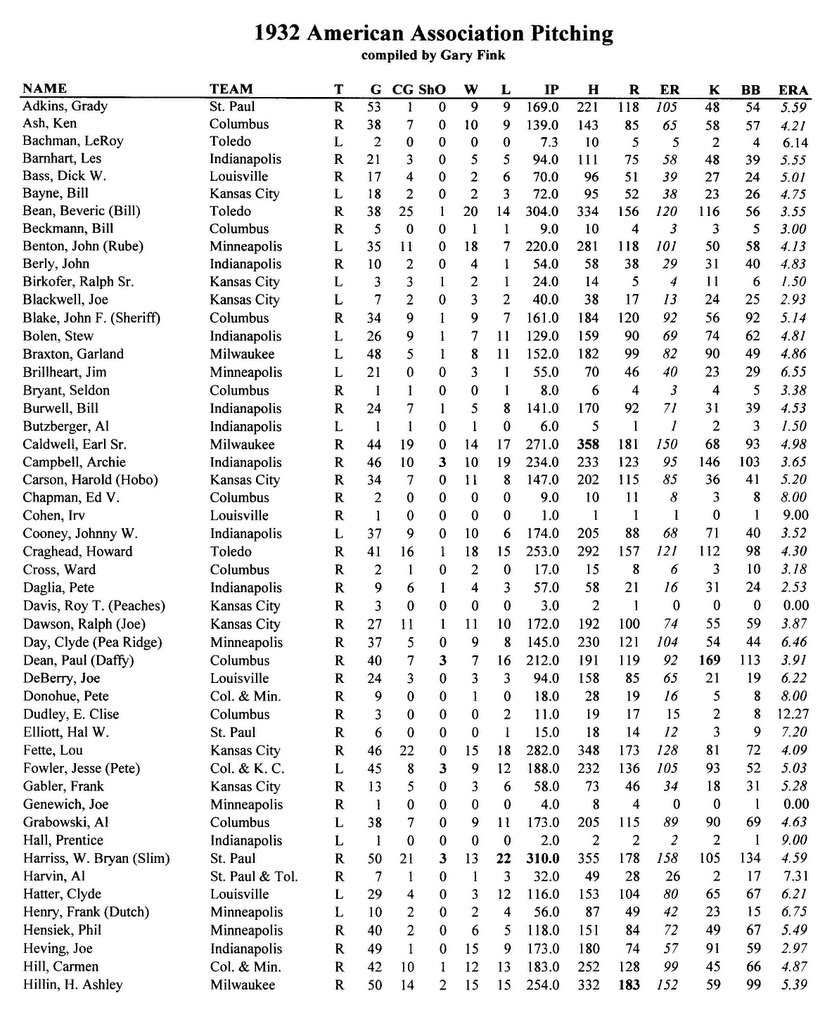
But the AA didn’t keep, or at least publish, batter walks in 1932. Apparently, there was a problem that year with official scoresheets from my hometown -- Columbus, Ohio -- that led to no earned runs being reported that year for any pitchers. This might have something to do with why no walks were compiled, but I’m not sure anyone knows for sure.
I wondered if there was a way to fill in the gap. There is. It’s hard work, but it can be done.
Let’s say you have culled the following information from a box score:
Name Pos AB
Clarke ss 4
Crawford 1b 4
LeBourveau lf 5
Swanson rf 4
Cullop cf 3
Riggs 3b 3
Rensa c 4
Whitehead 2b 4
Hill p 1
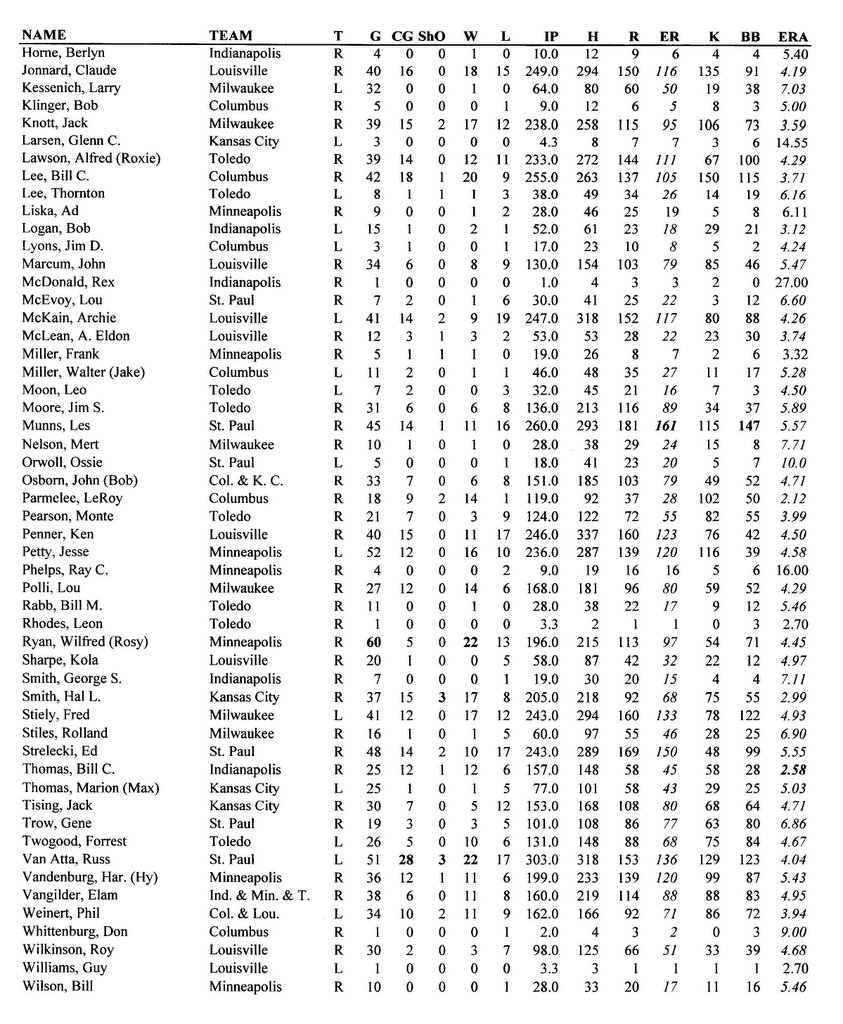
Sacrifices -- Hill; Bases on Balls, by Stiely, 6; Braxton, 1;
Could you tell from this which batters drew the seven walks allowed? Yes and with 100 percent accuracy, assuming the data in the box score is accurate. Unfortunately, that’s an assumption that fails on occasion.
The great thing about a box score is it follows the batting order. A batting order isn’t a random thing. Player C always will follow Player B and both always will follow Player A, no matter the game situation. Because of that, Player C cannot bat unless Player B has done so first, and Player B cannot bat until Player A has done so. Of course, Player A cannot bat a second time until the final player in the order has batted. So, if we know Player C has four plate appearances in a game and Player B also has four, we know with absolute certainty that Player A must have at least four and no more than five.
As you all know, a player’s plate appearance will result either in an at bat (with hits and outs calculated accordingly), a walk, a hit-by-pitch, a sacrifice or catcher’s interference.
What we have in the above minibox information, taken from a game May 9, 1932, is an accounting of every plate appearance except walks. We know how many at bats each batter had. We know there was one sacrifice and no batters hit by a pitch. There was no awarding of first on catcher’s interference, and that’s not surprising. I came across two for the entire 1932 AA season.
Because of that, we can figure walks. LeBourveau had five at bats, which means he had at least five plate appearances. That means Clarke and Crawford had to have had at least five plate appearances, too, and everyone below LeBourveau had to have had at least four.
To reach the magic number, we assign one walk apiece to Clarke, Crawford, Cullop and Riggs. Hill was missing three plate appearances, and we know he had a sacrifice, so that takes care of one. He gets two walks. That leaves one unaccounted-for walk. Now, with the plate appearances caught up, we just go down the batting order, and the next player after LeBourveau was Swanson. He gets our final walk. That would give Clarke through Swanson five plate appearances and every one else four.
Occasionally that year, the
Ohio State Journal ran a gamelog. This was one of those games, and it showed that Swanson walked in the second inning, Clarke in the third, Riggs and Hill in the fifth, and Cullop, Hill and Crawford in the seventh. That matches exactly what we guessed from the box.
Armed with this common-sense breakthrough and way too much free time, I went through microfilm of the
Journal and
Columbus Dispatch, which ran box scores for nearly every AA game in 1932. The results are below.
Eighty percent of all games that year were as easy as the above example. Just total up the walks allowed by pitchers on each team and parcel them out accordingly. The remaining games had two issues, one minor, the other not.
The minor issue involved player substitutions. Let’s say Player X replaces Player C in the lineup, and there is a missing plate appearance between the two. How do we know to whom to give the walk? Most of the time that could be determined from the box and the game story.
Pinch-hitters were the easiest to figure. If the box said Player X pinch-hit for Player C and Player X had zero at bats and nothing otherwise covered in the box, well, that HAD to be a walk. Pitchers were the next-easiest because nearly all boxes made mention of innings pitched. If a pitcher lasted into the fifth inning and had no at bats and nothing covered in the box, he HAD to have had at least one walk because at minimum he would’ve come to bat once in the first five innings of a game. That logic also works on fielders, although you need the game story to glean this information. You might find out, for example, that Player C scored a run in the seventh inning, yet he has only two at bats. No matter where he bats in the order, Player C HAD to have come to the plate at least three times if he were playing in the seventh inning, so he gets the walk.
By looking at microfilm of dailies from every other AA city in 1932, I was able to resolve most but not all of those conflicts. The rest probably never will be resolved, and I didn’t want to guess. [
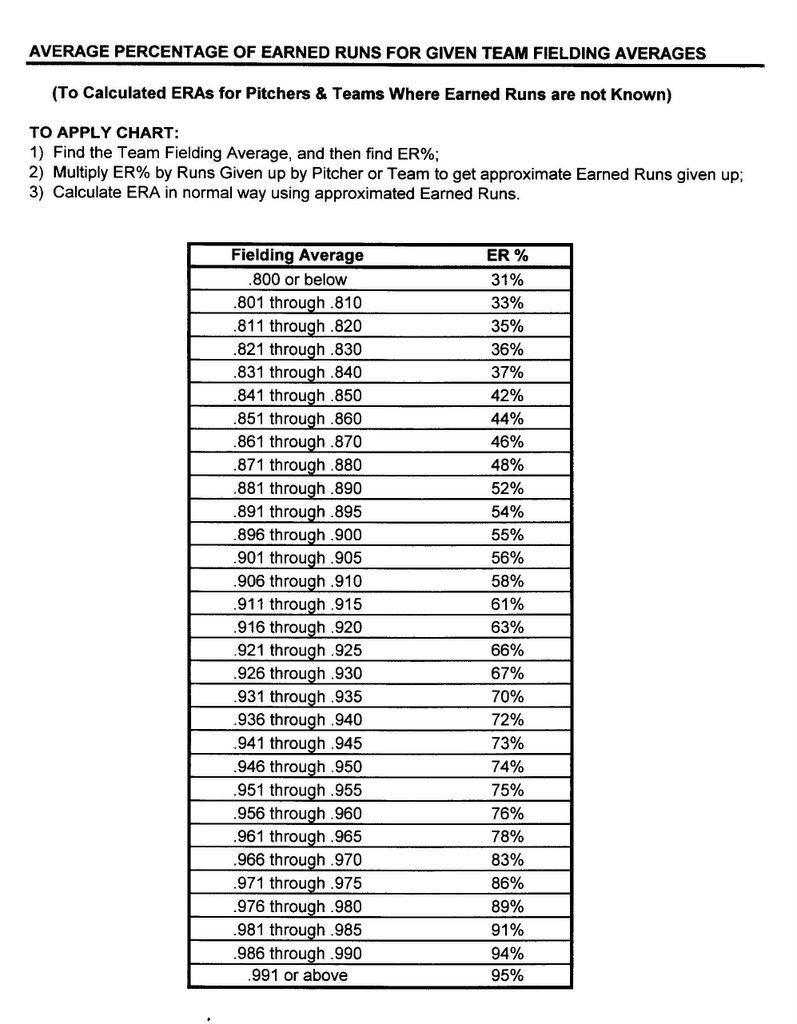
For me, I think Will should have given it his best guess, and then waited for someone to come along to correct that. Over the course of a season, one walk here or there will not make much difference for most players. In compiling pitching records, for example, there were times when I couldn’t determine how many outs there were in an inning when a pitching change occurred, so I made a rule for myself that give the first pitcher in an inning ⅓ of inning pitched, and the reliever ⅔ of an inning.]
The major issue was when the box information was incorrect. This happened less than 5 percent of the time, but when accuracy is the goal, that’s still troubling. For example, the Associated Press box that appeared in the
OSJ for the July 17 22-20 slugfest between the Minneapolis Millers and Indianapolis Indians listed Tribe pitchers as having allowed eight walks. The problem was that Foster Ganzel, the fifth batter in the Miller order, had seven at bats, and we needed 10 walks to fill in the missing plate appearances for the four batters above him. So what was incorrect: That Ganzel had seven at bats or that there should’ve been more walks charged to Indians pitchers?
While most similar conflicts were resolved by checking the information against box scores published in
The Sporting News, this one required the
Minneapolis Tribune. That box score, created presumably by the local writer, had Ganzel with seven at bats but Tribe pitchers charged with 12 walks, which fit with the total of missing plate appearances. The game story also mentioned 12 walks issued by the Indians, so I went with that.
When there were disagreements among sources, my first line of defense was to use gamelog information. The
Milwaukee Journal published play-by-play of nearly every 1932 Brewers game in extra editions. The
OSJ ran a gamelog about a third of the time. Those took precedence, even over the box scores. After that, I leaned with whatever made sense but typically going with the local-paper box scores and then
The Sporting News.
There were four games I was unable to resolve, so those walks are not counted. While compiling walks, I went ahead and kept track of batter HBPs, too, as those were listed in local and wire box scores. I should have made further notations about data changes and pitching logs but didn’t. I apologize.
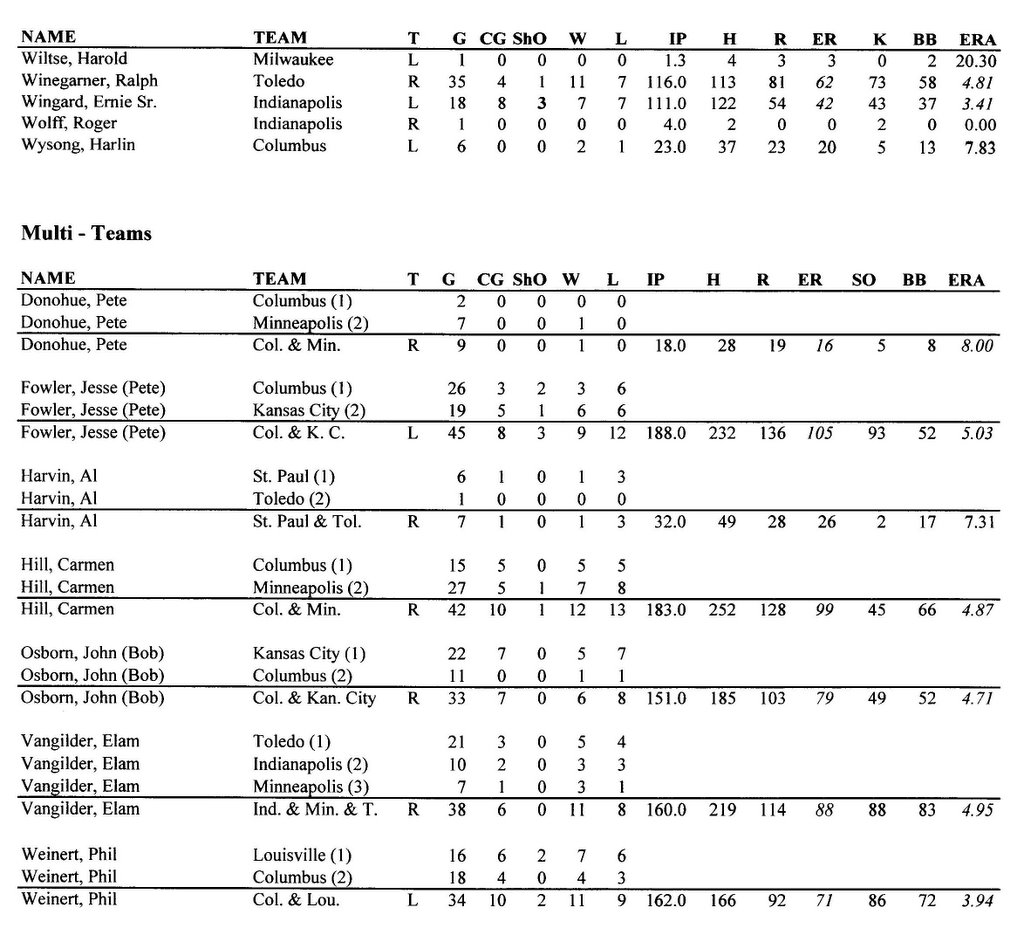
Tomorrow we’ll finish up this article by Will Christensen, and publish his totals for the 1932 American Association. As I told all of you, this is an amazing piece of research. Difficult, but extremely important.
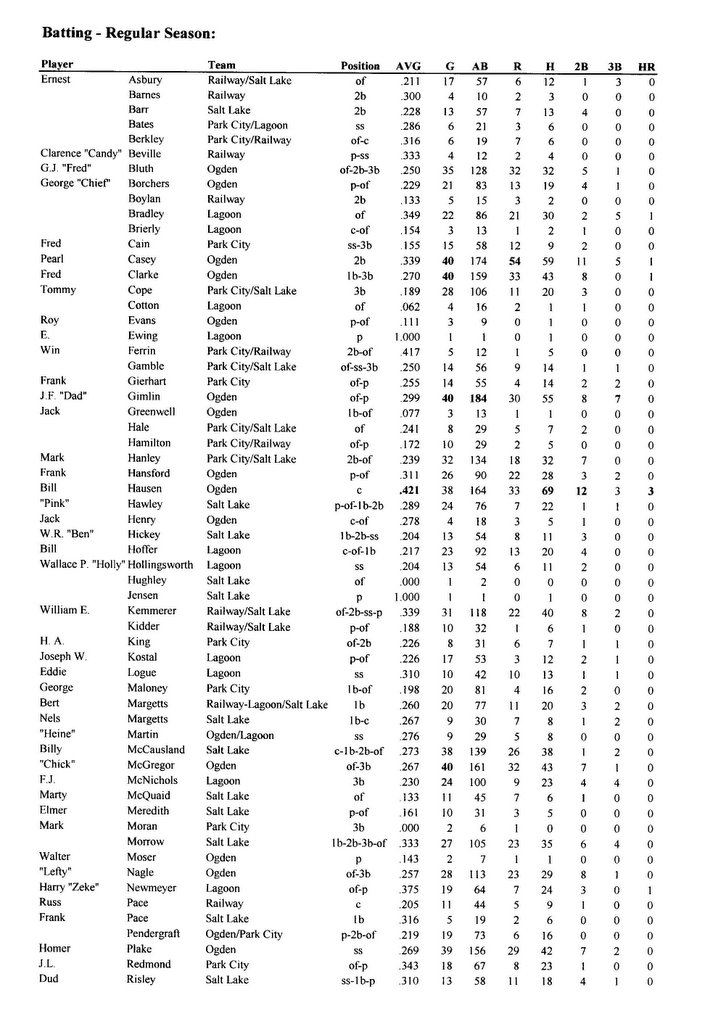

 Click on Images to Enlarge
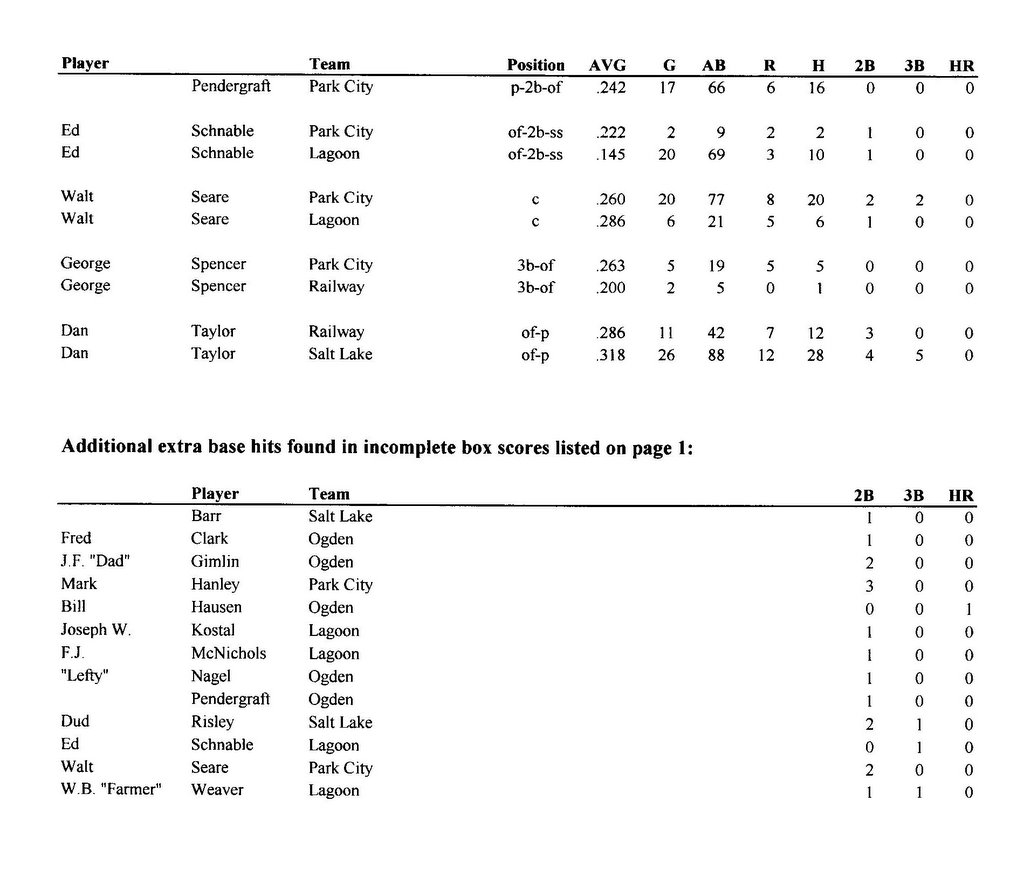